
Grafana Cloud Review
The managed version of the open-source Grafana stack, billed per metric series and per gigabyte. What the free tier really holds, what a five-engineer team pays on Pro, and where the usage meters bite.

Grafana Cloud is worth it for a team that wants managed Prometheus, Loki and Tempo without running them, and it is the cheapest commercial observability platform for most small teams. The free tier is permanent and covers 10,000 active metric series, 50 GB of logs, 50 GB of traces, 50 GB of profiles and 3 users with 14-day retention. Pro is a $19 monthly platform fee plus usage: $6.50 per 1,000 series above the included 10,000, $0.45 per GB of logs or traces above 50 GB at the included 30-day retention, and $8 per visualisation user above three. A five-engineer team sending 100 GB of logs and 50 GB of traces a month pays about $57.50 on Pro, against $129 on New Relic and $470 on Datadog for the same workload. Enterprise starts at a $25,000 yearly commitment. Prices were read on Grafana's pricing page in October 2026.
Key factsBest for: Teams on Prometheus and OpenTelemetry that want the…
- Managed Grafana, Mimir, Loki, Tempo and Pyroscope with the largest free tier among commercial observability platforms.
- Founded: Grafana Labs, December 2013
- Free tier: 10,000 series, 50 GB logs, 50 GB traces, 3 users
- Billing basis: Active series and gigabytes, not hosts or seats
- Open-source core: Grafana, Mimir, Loki, Tempo, Pyroscope, k6, Alloy
Pros
- Free tier of 10,000 series, 50 GB each of logs, traces and profiles and 3 users is permanent and runs a real product.
- Logs and traces cost $0.45 per GB above the allowance at the included 30-day retention and queries are free to 100 times the written volume.
- PromQL, LogQL, TraceQL and OpenTelemetry pipelines move to self-hosting unchanged.
Cons
- Metrics at $6.50 per 1,000 series punish high-cardinality labels; 50,000 series is $260 a month before logs.
- Correlating signals takes more setup than Datadog or New Relic, and APM-style views cost $0.025 per host hour extra.
- Enterprise needs a yearly commitment that is a steep step up from Pro's self-serve pricing.
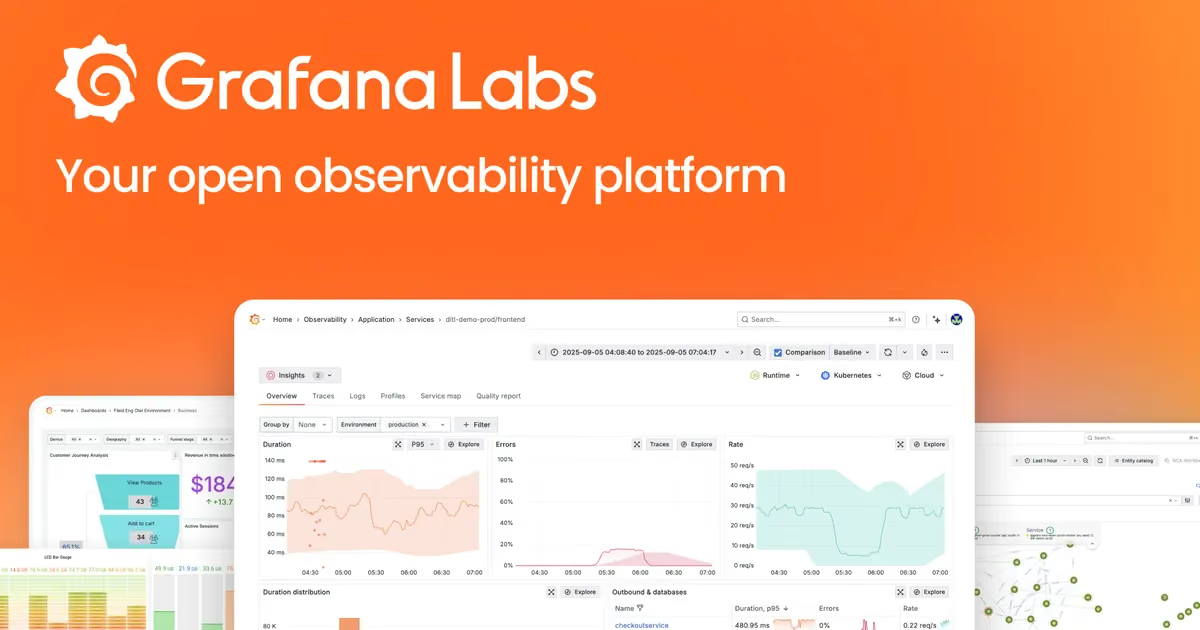
Grafana Labs built the dashboard half the industry stares at, then wrapped Loki, Mimir, Tempo and Pyroscope around it and sold the bundle as a hosted service.
Grafana Cloud is that bundle: the open-source stack, operated for you, metered on data rather than on hosts or seats. My view after pricing it against the suites: it is the best default for a team that knows OpenTelemetry and Prometheus and wants to keep the option of self-hosting, and a worse fit for a team that wants one agent, one product and no assembly.
This review is for developers and engineering leads deciding between Grafana Cloud, Datadog, New Relic and the OpenTelemetry-native challengers.
It covers what the platform includes in 2026, how the series and gigabyte meters work, what Free, Pro and Enterprise change, and the two traps buyers miss: cardinality on the metrics meter and the three-part log rate. The five alternatives at the end carry prices from their own pricing pages.
What is Grafana Cloud?
Grafana Cloud is a hosted observability platform from Grafana Labs, the company founded in December 2013 around Torkel Odegaard's open-source dashboard project and now led by CEO Raj Dutt.
Grafana Labs says it is trusted by more than 10,000 customers and maintains Grafana, Loki, Mimir, Tempo, k6, Pyroscope, Faro, Beyla and Alloy, which are the components under the service.
The product set covers metrics (Prometheus-compatible, backed by Mimir), logs (Loki), traces (Tempo), profiles (Pyroscope), and a layer of packaged apps on top: Application Observability for APM-style service views, Kubernetes Monitoring, Frontend Observability, Database Observability, Synthetic Monitoring for API and browser checks, k6 performance testing and IRM for on-call and incident response.
Grafana Assistant and Investigations add an AI layer billed per active user and per million tokens.
Everything is queried in the Grafana UI with PromQL, LogQL and TraceQL, which is the point: a team that has learned the open-source tools loses nothing by moving to the cloud and nothing by moving back. Compared with Datadog and New Relic, it is the less integrated suite; compared with SigNoz and Better Stack, it is the broader one.
How Grafana Cloud works
You send data with Grafana Alloy, the OpenTelemetry collector or any Prometheus remote-write client, and each signal lands on its own meter. Metrics are billed on active series, where an active series is a time series that received a data point in the previous 20 minutes.
Grafana Cloud bills the 95th percentile of active series over the month, which forgives roughly the top 36 hours of a 720-hour month, so a short spike does not set the invoice. Pro includes 1 data point per minute per series; send more and the bill is based on total data points instead.
Logs are billed in parts. Gigabytes processed are charged when the data arrives, gigabytes written are charged after optimisation with a 50 GB free allotment, and gigabytes retained are charged per 30-day increment beyond the included retention, which is 14 days on Free and 30 days on paid accounts.
Queries are free up to 100 times the written volume each month. Traces and profiles follow the same three-part rate.
The platform fee is the odd piece. Pro charges a flat monthly fee before any usage, and that fee buys the longer retention (13 months for metrics, 30 days for logs), the 8x5 email support and the ability to exceed the free allowances at all.
Free accounts hit a hard ceiling; Pro accounts bill for the overage. Enterprise is a custom contract with a high yearly minimum and metrics as low as $3 per 1,000 series, which only pays off well past a million series.
Grafana Cloud key features
Grafana Cloud pricing
Every Grafana Cloud rate on this page was read on Grafana Cloud pricing in October 2026 and the billing mechanics on Grafana's invoice documentation the same month. Competitor figures come from Datadog pricing, New Relic pricing, SigNoz pricing, Better Stack pricing and Honeycomb pricing, read the same month.
The metrics meter is the one to watch. Pro includes the same 10,000 series as Free and charges per 1,000 above that, so 50,000 series cost $260 a month before any logs. A single label with high cardinality, a user ID or a request ID, can push a small service from hundreds of series to tens of thousands with no change in traffic. Logs and traces are cheaper than they look. The headline rates are $0.05 to process and $0.40 to write per GB, so a gigabyte above the 50 GB allowance costs $0.45 in total at the included 30-day retention; the $0.10 retain charge applies only to each extra 30 days kept, and queries up to 100 times the written volume are free. Visualisation users cost $8 each above three, which matters for a company where everyone opens dashboards, and users with enterprise plugins cost $55.
Cost scenario, computed from those rates: a five-engineer startup on ten hosts sending 100 GB of logs and 50 GB of traces a month, with all five using dashboards and metrics inside the included 10,000 series. Pro comes to the platform fee, $22.50 for the 50 GB of logs above the allowance, nothing for traces inside their allowance, and $16 for the two users above the free three: about $57.50 a month. Add Application Observability on all ten hosts and the bill rises by roughly $180 to about $238. The same team pays $129 on New Relic (50 GB above its free 100 GB plus two Standard full-platform seats) and $470 on Datadog (Infrastructure Pro at $15 per host, APM at $31 per host and per-GB log ingest) before any log is indexed.
Devshot data: Grafana Cloud is listed as an alternative to 11 other tools on Toolradar, the software directory we run, and its entry paid plan ranks joint 6th of 23 for price among the log management tools the directory prices, as of October 2026. Across the 210 monitoring tools Toolradar tracks, 64% offer a free tier; Grafana Cloud's is the one with the widest allowances among the commercial suites.
| Plan | Price | Best for |
|---|---|---|
| Grafana Cloud Free | Free | 10,000 active series, 50 GB logs, 50 GB traces, 50 GB profiles, 50k frontend sessions, 3 users, 14-day retention |
| Grafana Cloud Pro platform fee | $19/mo | Unlocks overage billing, 13-month metric retention, 30-day log retention and 8x5 email support |
| Pro metrics | $6.50 per 1,000 active series above 10,000 | Billed at the 95th percentile of the month, 1 data point per minute per series included |
| Pro logs, traces and profiles | $0.05 process, $0.40 write per GB; $0.10 retain per GB per 30 days beyond 30 | 50 GB included per signal, 30-day retention, queries free to 100x written volume |
| Pro users | $8 per active user above 3 | $55 per user with enterprise plugins; $20 per IRM user above 3 |
| Pro Application Observability | $0.025 per host hour, about $18/host/mo | 2,232 host hours free; Kubernetes Monitoring $0.01 per host hour on top |
| Pro Synthetics and k6 | $5 per 10,000 API executions; $0.15 per virtual user hour | 100,000 API executions, 10,000 browser executions and 500 virtual-user hours free; browser checks $50 per 10,000 |
| Pro Grafana Assistant | $20 per active AI user, $2 per million extra tokens | 40 million tokens included per user; Free gets 3 AI users |
| Grafana Cloud Enterprise | Custom, $25,000/yr minimum | Metrics as low as $3 per 1,000 series, custom retention, premium support |
| Datadog Infrastructure Pro and APM | $15/host/mo plus $31/host/mo, annual | Free for 5 hosts; logs billed per GB ingested plus $1.70 per million events indexed |
| New Relic | Free to 100 GB/mo; $0.40/GB after; seats from $10 | Standard full-platform users $99 each after the first, capped at 5; Pro $349 each |
| SigNoz Teams | $49/mo minimum | Logs and traces $0.30/GB, metrics $0.10 per million samples, unlimited members; self-hosted free |
| Better Stack | Free for 10 monitors; Nano telemetry $38/mo, responders $29/mo (yearly, US) | 40 GB each of logs, traces and metrics on Nano; dashboard users free |
| Honeycomb | Free to 20M events; Pro from $150/mo | 750M events and 3.75B metric data points on Pro, unlimited seats on every plan |
Grafana Cloud pros and cons
What we like
- Free tier of 10,000 series, 50 GB each of logs, traces and profiles and 3 users is permanent and runs a real product.
- Logs and traces cost $0.45 per GB above the allowance at the included 30-day retention and queries are free to 100 times the written volume.
- PromQL, LogQL, TraceQL and OpenTelemetry pipelines move to self-hosting unchanged.
What could be better
- Metrics at $6.50 per 1,000 series punish high-cardinality labels; 50,000 series is $260 a month before logs.
- Correlating signals takes more setup than Datadog or New Relic, and APM-style views cost $0.025 per host hour extra.
- Enterprise needs a yearly commitment that is a steep step up from Pro's self-serve pricing.
Who Grafana Cloud is for
Grafana Cloud fits teams that already speak Prometheus and OpenTelemetry and want the stack operated for them. A platform engineer who has run Loki once and never wants to again is the ideal buyer: the queries and dashboards transfer, the data meters reward sampling discipline, and self-hosting stays a real option.
It also fits early-stage startups, because the free tier carries a live product and Pro's bill tracks data rather than headcount.
It is a weaker fit for teams that want one agent and one integrated product. Correlating a trace with its logs and the host it ran on works, but it takes configuration that Datadog and New Relic do for you.
It is also the wrong choice for a company that expects to pass a million metric series without an Enterprise contract, and for a team whose first need is external uptime checks and paging, where Better Stack bundles both for less.
Best Grafana Cloud alternatives
If Grafana Cloud is not the right fit, these are the closest options.
| Tool | Best for | Starts at | |
|---|---|---|---|
| Grafana Cloud | Teams on Prometheus and OpenTelemetry that want the open-source stack managed and the option to leave. | Free: 10k series, 50 GB logs, 50 GB traces, 3 users | Visit → |
| Datadog | Teams that want the broadest integrated suite and can govern per-host, per-product spend. | Free for 5 hosts | Visit → |
| New Relic | Teams with heavy telemetry and only two or three engineers who need full-platform access. | Free: 100 GB/mo ingest and 1 full user | Visit → |
| SigNoz | OpenTelemetry-first teams that want one bill for logs, traces and metrics with unlimited members. | Self-hosted free | Visit → |
| Better Stack | Small teams that want uptime checks, on-call and a log store on one fixed-size bill. | Free: 10 monitors, 3 GB logs | Visit → |
| Honeycomb | Teams chasing high-cardinality bugs across many services, with no seat limit. | Free to 20M events/mo with unlimited seats | Visit → |



The bottom line
Grafana Cloud is the right choice when your team knows the open-source stack and wants it run for them at a price that tracks data. The free tier is the widest among the commercial platforms, Pro adds a small platform fee plus usage, and the cost scenario above lands a five-engineer team at a fraction of the $129 New Relic and $470 Datadog bills for the same workload. The open formats mean the decision is reversible, which no other suite here can say.
Walk away in three cases. If you want one agent and one integrated product with no assembly, Datadog or New Relic will cost more and save engineering time. If metrics cardinality is high and uncontrolled, the per-series meter will hurt and Honeycomb's event model fits better. If your first need is uptime checks and paging, Better Stack bundles both for less. See our best monitoring tools ranking, the best observability tools for startups cost comparison, Datadog alternatives priced at ten hosts, the log management comparison, the New Relic review, the Datadog review and the Better Stack review, plus the Grafana Cloud, Datadog and SigNoz entries on Toolradar.
Methodology: every price on this page was read on the vendor's own pricing page in October 2026, the billing mechanics come from Grafana's invoice documentation, and the cost scenarios are computed from those published rates; the directory figures come from Toolradar's tool and statistics pages as of the same month. No hands-on lab test was run. Cite this: Devshot, "Grafana Cloud Review 2026: Pricing, Free Tier, Limits", October 2026.
Frequently asked questions
How much does Grafana Cloud cost?
Is Grafana Cloud worth it?
Is Grafana Cloud free?
Grafana Cloud vs Datadog: which is cheaper?
What is an active series in Grafana Cloud?
What are the best Grafana Cloud alternatives?
Sources
Prices and plan details come from each vendor's own pricing page, re-checked by the Toolradar pricing tracker.
- Grafana Cloud pricingchecked Sep 2026
- Datadog pricingchecked Sep 2026
- New Relic pricingchecked Sep 2026
- Honeycomb pricingchecked Sep 2026
Some offers on this page may be paid placements or contain affiliate links.
Get the Devshot brief
Free daily newsletter, read in 5 minutes.
Subscribe free